Debugging Slow End-to-End Tests 🐢
This is a story of how I managed to reduce a Cypress test suite’s total runtime by 83%.
Introduction
When slow-running tests become too painful to ignore ⛔
At work, I had to add a new endpoint to a TypeScript API. This was a nice and simple piece of work, nothing complex.
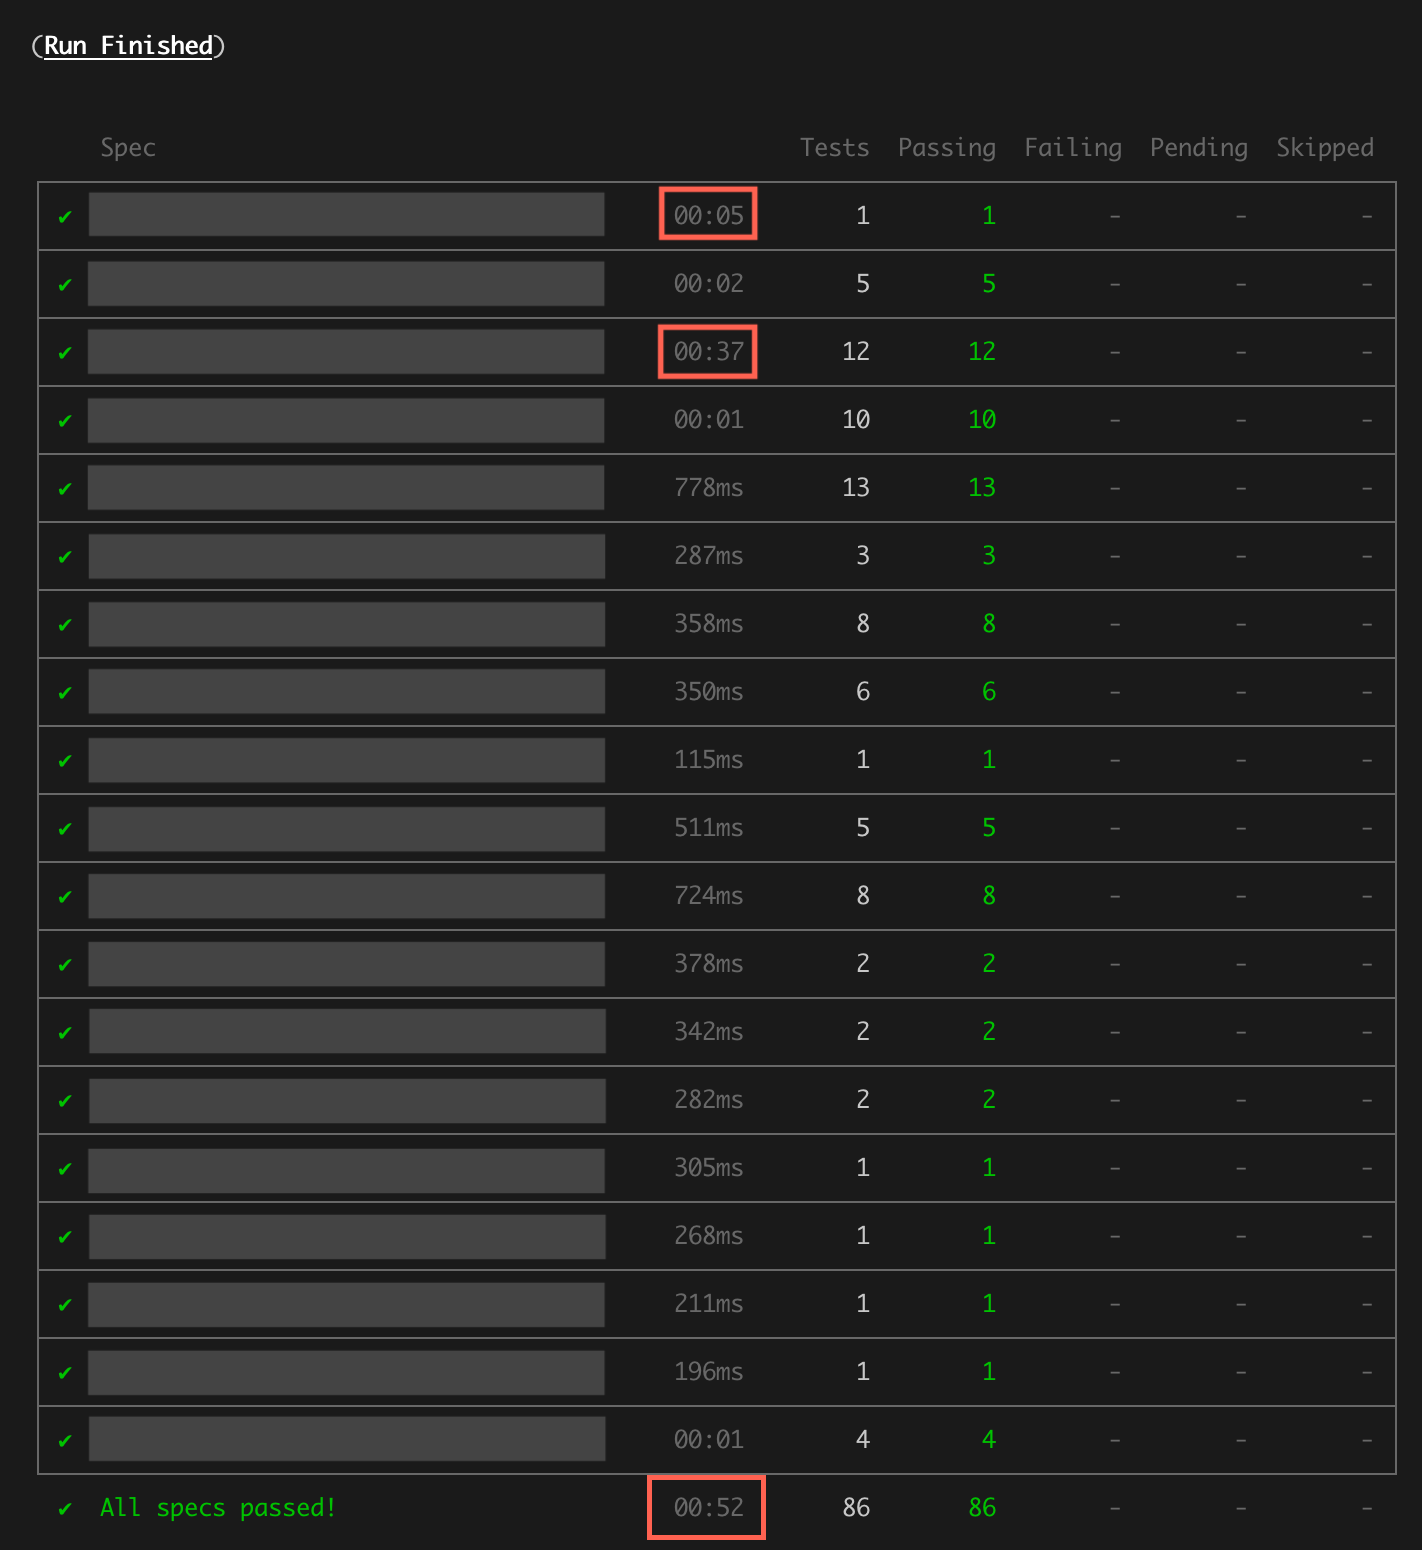
However, when I ran the end-to-end tests locally, they took 52 seconds to run!
Now, you might be thinking, “Wow, 52 seconds, that’s so fast!”. Yes, it is fast compared to some test suites, but:
- These tests were each supposed to be taking ~100ms or so to run, so the full test suite should’ve been finishing within 10 seconds maximum.
- This doesn’t actually reflect the true total runtime, it only reflects the time recorded by Cypress (i.e. it doesn’t reflect the time Cypress takes between tests), so it was actually more painful than it sounds.
- This was a very new codebase, and during the few weeks I’d been off work, the test suite’s total runtime had somehow become 5-10 times slower.
Fast test suites are amazing 🧡
Also, it’s worth noting some things about test suites generally:
- It is essential to keep total test suite runtime as low as possible, especially when running the tests locally, to avoid interrupting our development flow, and therefore to keep us engineers happy.
- In the long run, faster test suites are less painful, more fun to work with, and generally add so much value.
The right time (to investigate and fix)
I really felt this was something that needed fixing.
I had first noticed the slow tests about a month prior to this, after returning to work following leave. Due to other work priorities, I hadn’t been able to investigate the root cause yet.
But now that it was directly affecting me, and I had a few hours free thanks to a very productive work day, it felt like a perfect time to look into this.
Overview
The API
For context, the app was an API that was:
- Written in TypeScript
- Using Koa as a web framework
- Using Cypress for end-to-end tests
- Running the tests in a docker container
Chapter 1: The Investigation Begins
Where to look first? 🤔
To start with, I ran the full end-to-end test suite locally.
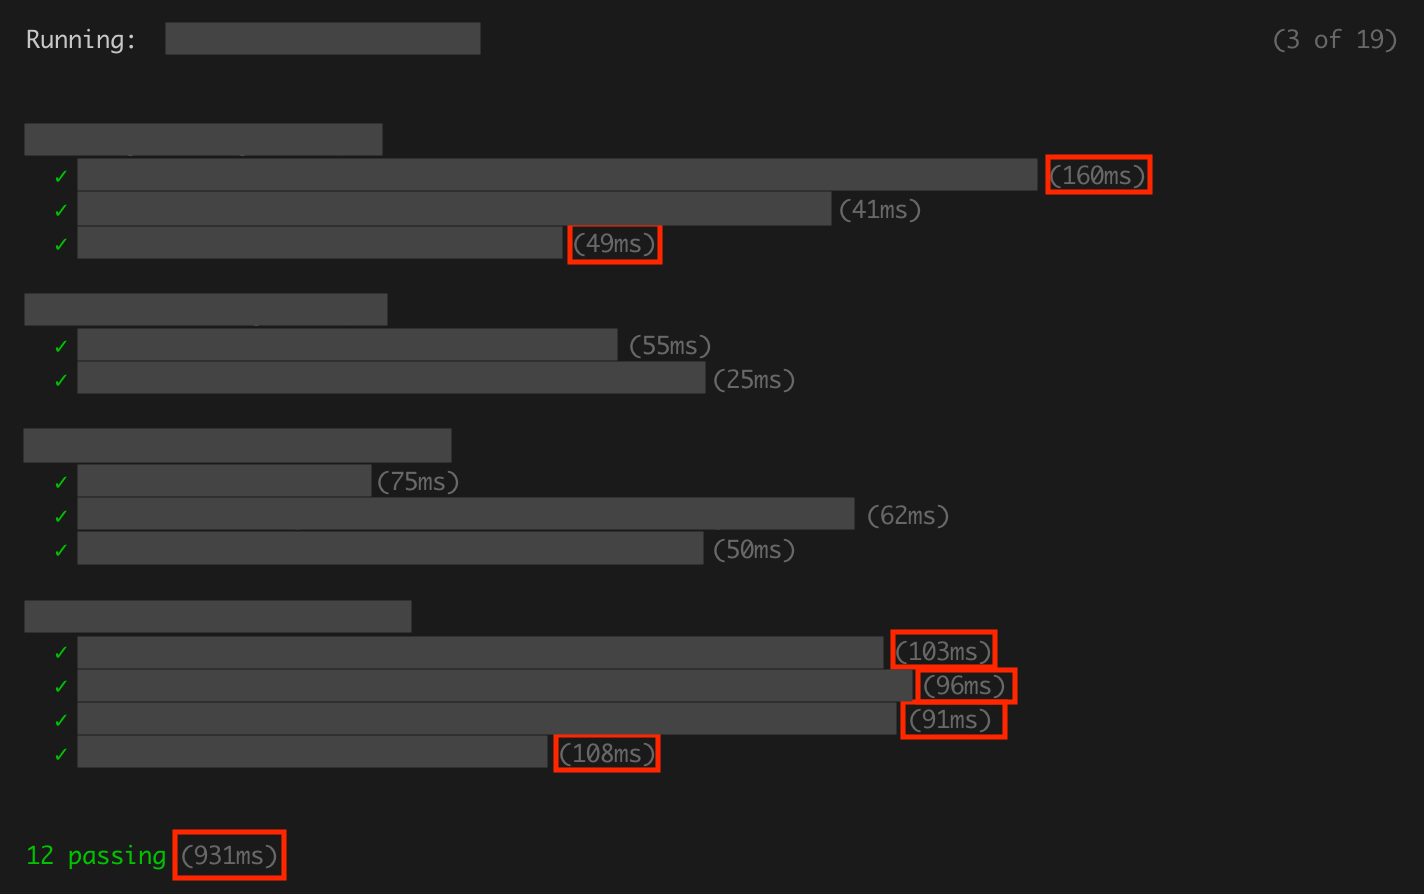
Immediately, in the Cypress summary, it was clear that most of the test files were ok, and that there were only two test files that were taking excessively long compared to the rest.
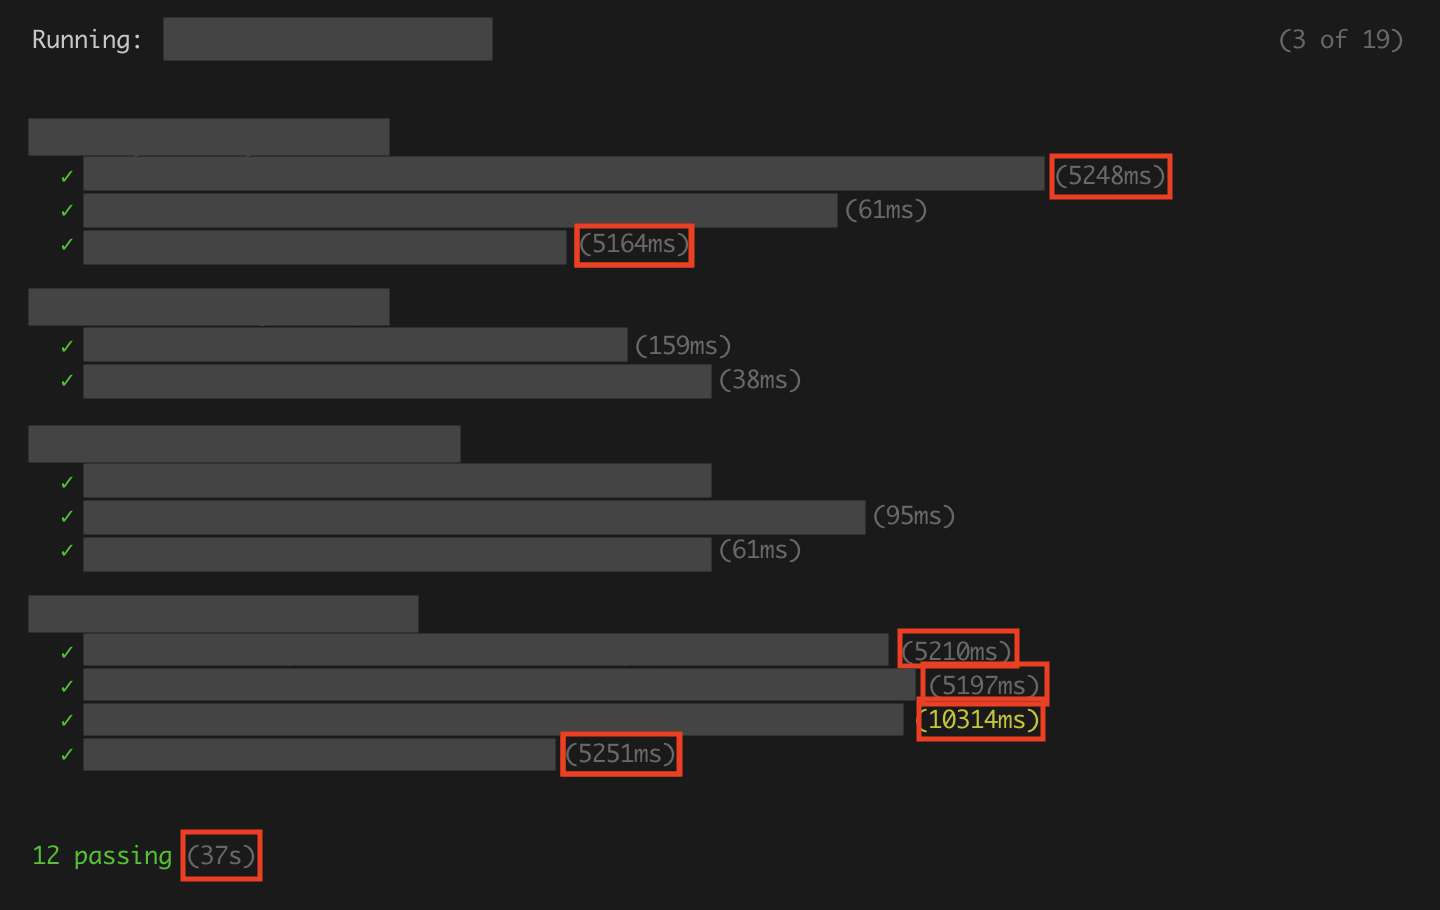
So, I zoomed in on the Cypress summary/breakdown for the slowest test file, and it was clear that only some of the tests in that file were slow.
Next, I opened up the test file and read through the first offending test. Whilst there were several things I would’ve changed about the test itself, there wasn’t anything obvious that would take so long to run.
Hmm…
I decided to dive deeper. Since the tests were being run in a docker container, I wasn’t sure of how to add breakpoints to the test to be able to stop partway through the code, like I would when using Pry on Ruby and Rails projects.
So, I decided to take the basic approach of manually adding console logging lines throughout the test, to hopefully demonstrate where the slowness was.
However, all of the logging happened instantaneously, suggesting that there wasn’t anything slow happening within the test itself.
Hmm…

What if the slowness was happening during the test setup/teardown phase? It shouldn’t have been, since the app was using the same setup/teardown logic for all tests, even the fast ones.
I tested that using console logging, and surely enough, all of the logging happened instantaneously, like before.
I was stumped. Somehow, the tests were taking what seemed like forever to run, but the test logic seemed very fast. What was causing the delay?
Some Key Observations
Whilst I sat there flicking through the test code and console outputs, hoping to magically find the root cause, I suddenly noticed something: the duration of each slow test seemed to be multiples of 5 seconds, e.g. ~5s or ~10s.
An idea occurred to me. I quickly checked, and confirmed two things:
- Each slow test called at least one of three specific POST endpoints
- Each call to those endpoints seemed to add another 5s to the test, i.e.:
- Tests that made 1 endpoint call took ~5s
- Tests that made 2 endpoint calls took ~10s
But what was causing these 5 second delays?
At this point, it became clear that I needed to start manually testing those endpoints, and that perhaps this wasn’t just a test suite issue.
Chapter 3: Debugging the Endpoint 💻
I started up the app locally and manually tested the first affected endpoint using Postman.
The request seemed to complete reasonably quickly, but the total response time kept increasing until it reached ~5s.
I decided to dive deeper by adding lots of breakpoints throughout the code and running a JavaScript Debugging Terminal in VSCode, which I stepped through line-by-line. Nothing seemed to take a long time, but the request still seemed to take around 5s after the response had seemingly returned.
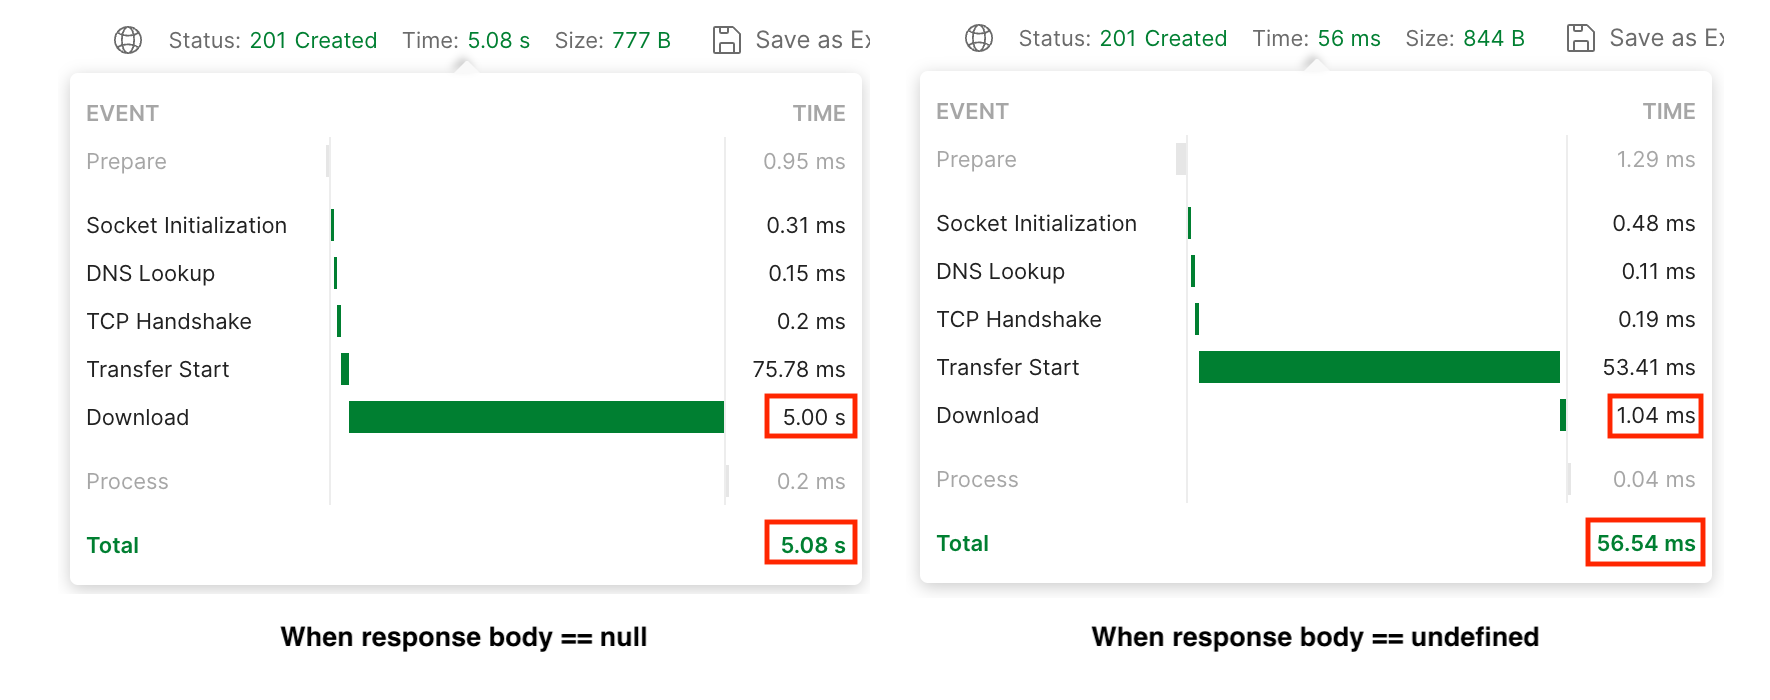
Fortunately, something caught my eye: the response body was null.
Confirming the Root Cause
I had been part of the team that had written this application over the previous six months, and we had been returning undefined as the response body whenever we didn’t want to return anything. I hadn’t seen us return null before, but surely that couldn’t be adding 5 seconds here, could it?
I quickly tested using undefined instead, and surely enough, it fixed the issue!
At this stage, after doing some exploring and clicking, I realised that Postman actually provides a clear breakdown of the response time into different categories. I’m still not sure what each part represents, but when returning null from the endpoint, the response had a 5s download time, versus a 1ms download time when returning undefined.
Also, using VSCode’s search functionality, I could see that we were using a null response body on the exact three endpoints that were involved in the slow-running tests, so I was now certain that this was the root cause.
Checking for Impact
Before doing anything else, I tested one of these endpoints from a downstream application to check for potential impact, and fortunately, the consumer session didn’t seem to be affected, so the impact only seemed to be limited to the test suite and the CI pipeline.
Chapter 4: Koa’s Unexpected “Feature” 🔍
I did some Googling, and managed to discover that whenever the response body value is null, Koa automatically removes three headers from the response (source code), namely:
Content-TypeContent-LengthTransfer-Encoding
Next, I presented the root cause analysis to the rest of the team. My manager confirmed that the missing Content-Length header likely meant that the receiver (in this case, Cypress) couldn’t tell in advance how long the response would be, and so instead defaulted to attempting to download the response until it hit a timeout limit of 5s.
In particular, my manager quoted from this Stack Overflow answer, which seemed to support that theory:
Generally the
Content-Lengthheader is used for HTTP 1.1 so that the receiving party knows when the current response* has finished, so the connection can be reused for another request.
So, we now had a good understanding of the root cause, specifically:
- What it was;
- Why it had that effect;
- How we could fix it;
- How we could avoid running into it ever again in future.
Conclusion: The Result 📊 ✅
- Action: For the three culprit endpoints, I changed the response body from
nulltoundefined. - Result: Total test suite runtime reduced from 52s to 9s, i.e. by 83%! 🥳 🎉 ✨
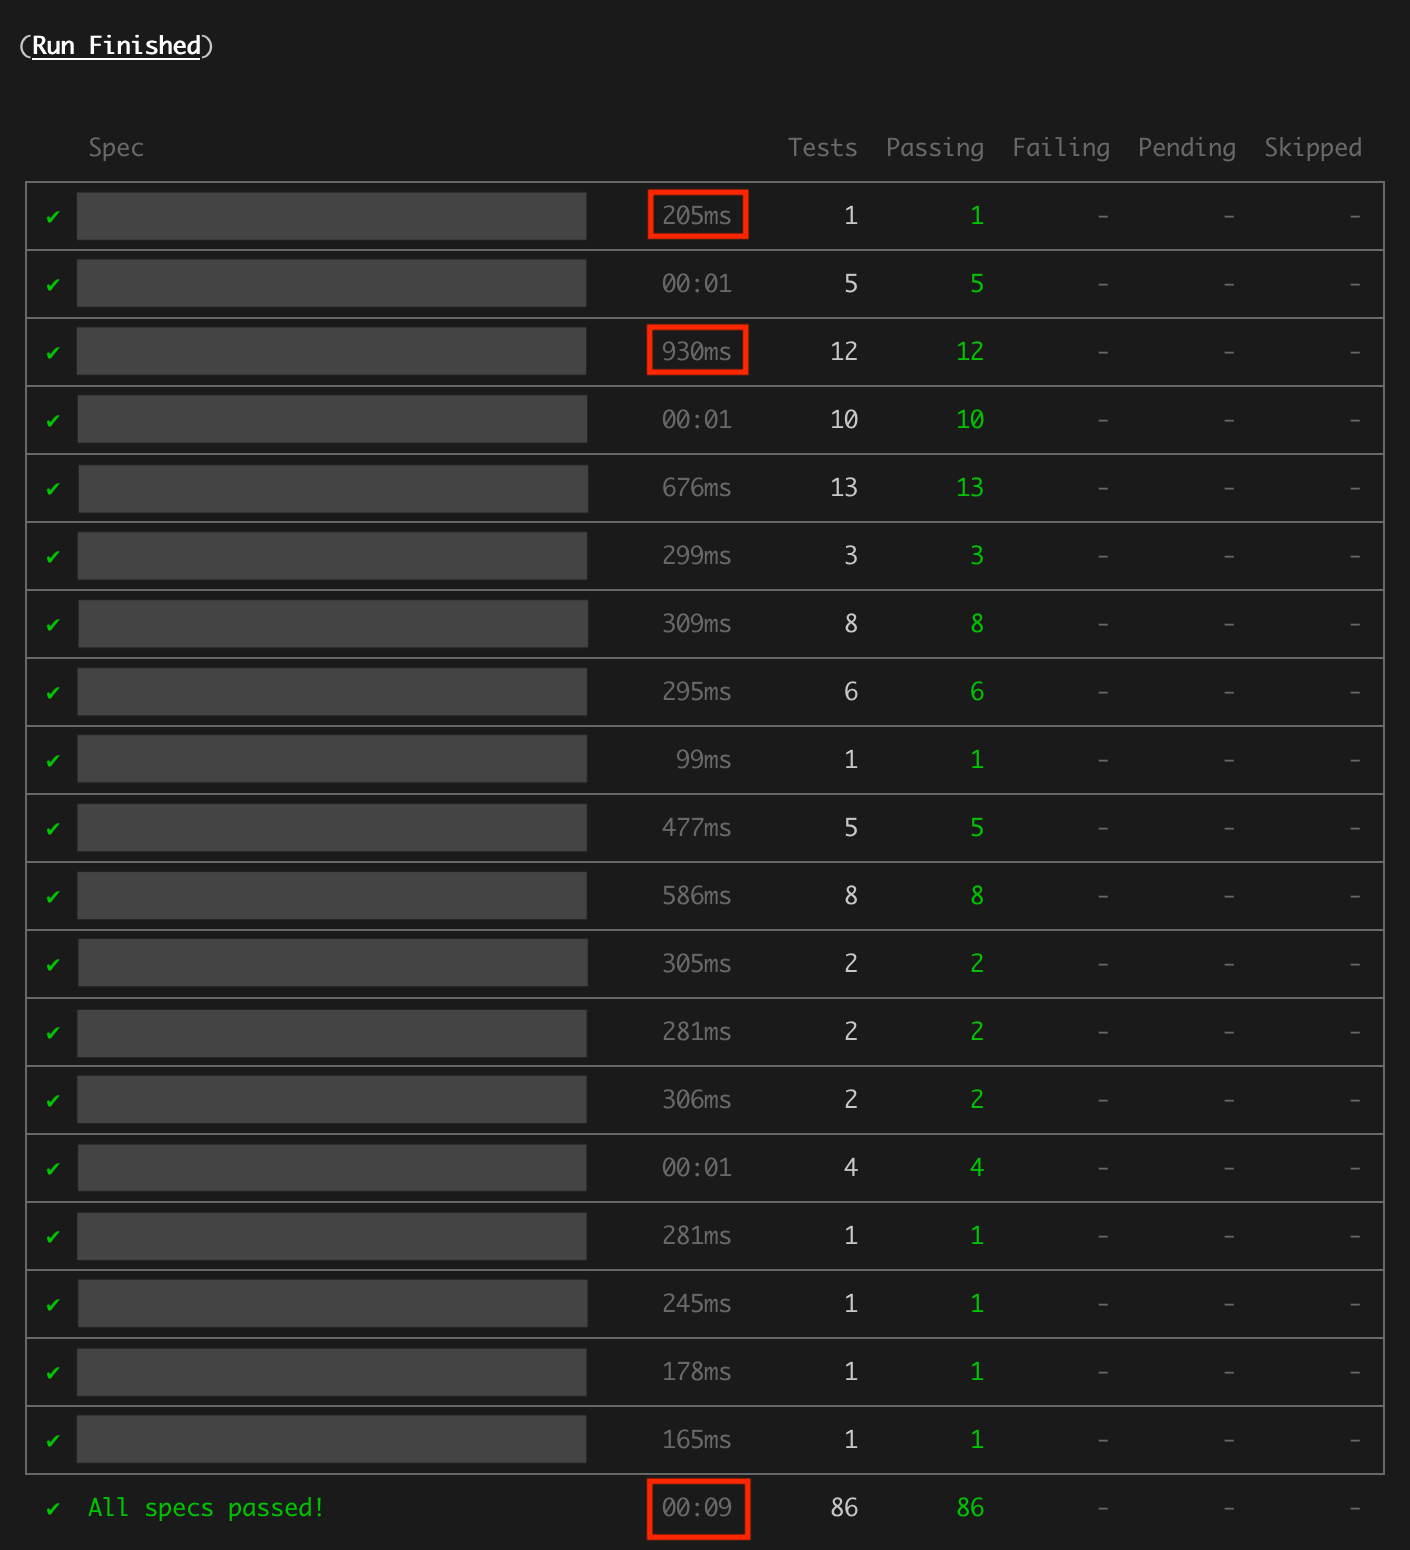
In particular, the slowest test file’s total runtime had dropped from 37s to less than 1s!
My Final Thoughts
Overall, this piece of work achieved a massive quality-of-life improvement for the team’s engineers, amongst other benefits, and I found it a very satisfying problem to have solved.